UML diagrams: all 14 types explained with examples
A UML diagram visually represents a system using standardized types. Learn which of the 14 types matter most and how AI tools now generate them automatically.
Visual process documentation helps teams understand systems and workflows at a glance. Here’s how we approach process documentation.
Tallyfy is the only product available that does Process Documentation and Process Tracking in one
Summary
- UML has 14 diagram types split into structural and behavioral - class, sequence, activity, and use case diagrams are the ones you’ll actually use 80% of the time, while the rest exist for specialized scenarios
- AI tools now generate UML diagrams from plain English - describe what you want to Claude, ChatGPT, or GitHub Copilot and get Mermaid or PlantUML code that renders instantly, making traditional drag-and-drop tools feel ancient
- Activity diagrams matter most for business process documentation - these flowchart-style diagrams with swimlanes expose bottlenecks, handoffs, and inefficiencies far better than written procedures ever will
- UML 2.5.1 is still the current spec - no UML 3.0 exists yet, but the OMG’s KerML work signals where things are heading. Visualize your workflows with Tallyfy
A UML diagram is a standardized way to visually represent a system - its structure, behavior, actors, and interactions. UML stands for Unified Modeling Language, and it gives you 14 different diagram types to work with. That sounds like a lot. It is. But honestly, most people only need four or five of them.
We built Tallyfy because we kept seeing helping organizations map their workflows, we’ve seen something fascinating. Teams that couldn’t agree on how a process worked would sit down, draw an activity diagram, and within 20 minutes everyone spotted the same three bottlenecks. No arguments. No “well, we do it differently.” Just clarity.
That’s the real power of UML. Not the formalism. The shared understanding.
What is UML
UML stands for Unified Modeling Language. It’s a standardized way to draw diagrams that represent software systems - and increasingly, business processes too.
Here’s the backstory. In the 1990s, software development was a mess. Every team had their own notation for diagrams. Your class diagram looked nothing like mine. So in 1994-1996, three engineers at Rational Software created UML to end the chaos. It became an official standard in 1997 and hasn’t changed dramatically since - the current version is UML 2.5.1, released in 2017.
Why does that matter? Because stability is actually a feature here. UML isn’t chasing trends. It’s a shared language that works whether you’re documenting a database schema or mapping an employee onboarding workflow.
UML finds different uses depending on context:
As a sketch - quick whiteboard diagrams to communicate ideas. You’re not trying to be complete. You’re trying to get everyone on the same page. Forward design happens before coding. Backward design happens after, as documentation.
As a blueprint - complete specifications that someone could implement directly. This is where CASE tools come in, and they’re not cheap. Most teams don’t need this level of detail.
As pseudo-code - some tools can generate actual code from UML diagrams. Frankly, this only makes sense when drawing the diagrams takes less time than writing the code. Which is rare.
Types of UML diagrams
There are 14 UML diagram types, split into two categories: structural (what exists) and behavioral (how things interact). The Pareto Principle applies here - about 20% of diagram types handle 80% of real-world needs.
Behavioral UML diagrams
These show how a system behaves over time - actions, interactions, and state changes.
Activity diagram
This is the one that matters most for business process modeling. One thing that keeps coming up teams adopt activity diagram concepts to visually map their workflows before implementing them in our platform.
Activity diagrams look like flowcharts on steroids. They show sequential and parallel activities, the objects involved, and how everything connects. Diamond shapes handle branching and loops.
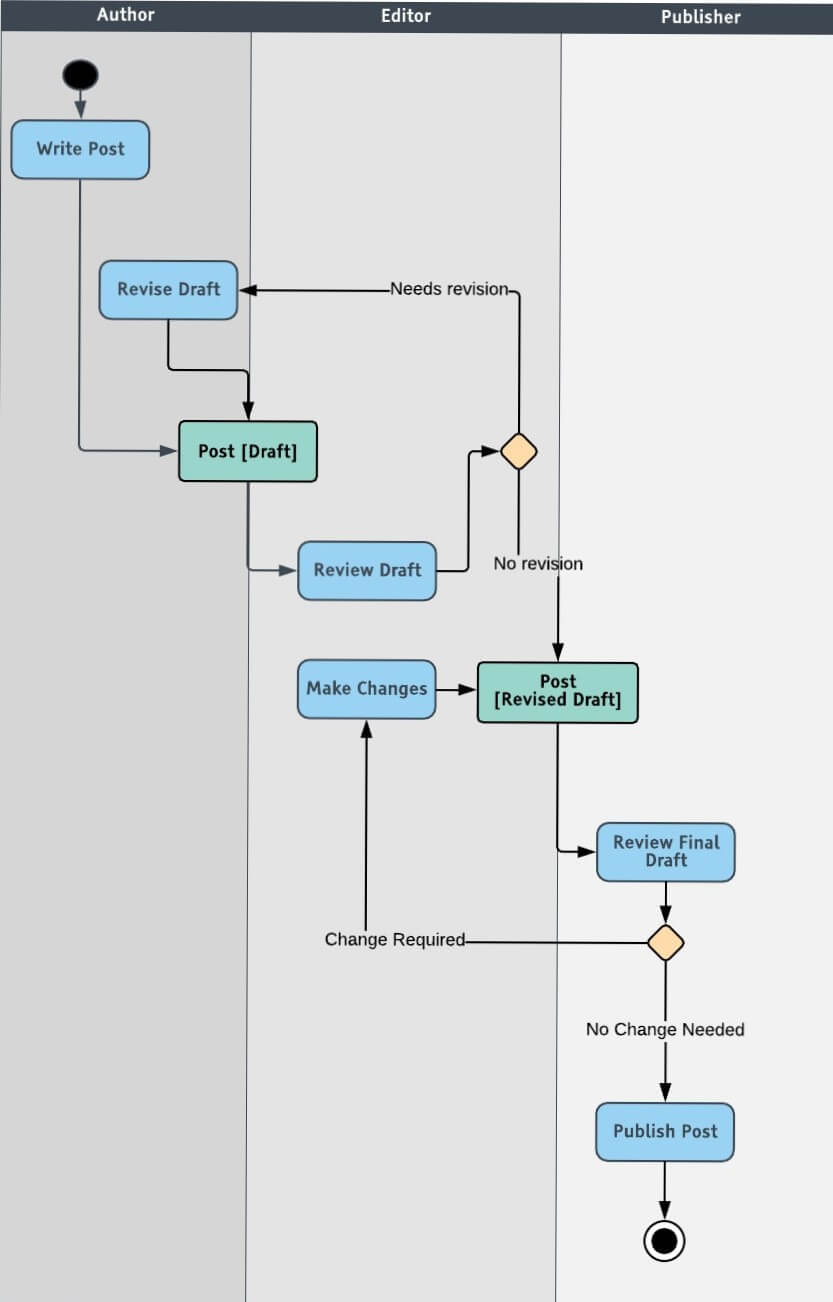
This example shows a content publishing process. The author writes, the editor reviews, the publisher approves. When the reviewer wants changes? Loop back. The author revises. Push it through again. In a business context, this is called business process mapping.
And honestly? This is where most people should start with UML. Not with class diagrams.
Use case diagram
Before you design anything, figure out what users actually need to do. That’s what use case diagrams are for.
Three components:
- Functional requirements - use cases, represented as verbs
- Actors - humans, organizations, or systems that interact
- Relationships - arrows connecting actors to use cases
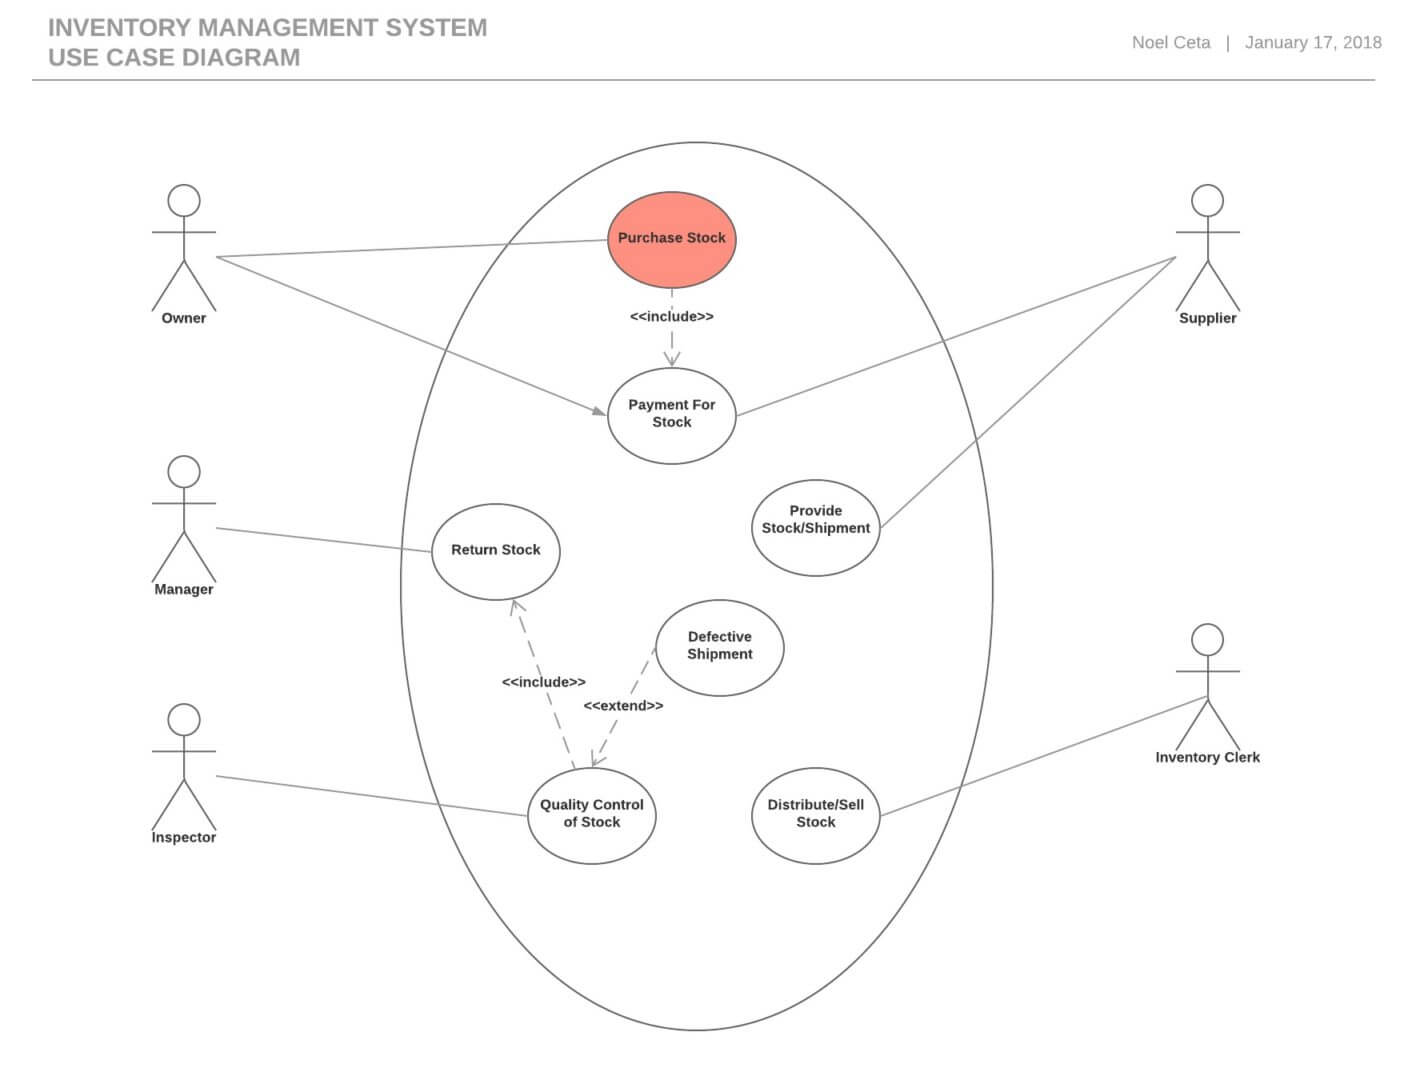
This inventory management example shows five actors connected to actions like purchasing stock, quality control, and distribution. Simple. Clear. No implementation details to confuse anyone.
Sequence diagram
Probably the most important UML diagram for both developers and business process documentation. These show the chronological sequence of messages between actors and objects.
Why are they so popular? Because they’re visually self-explanatory. Even non-technical people can follow them.
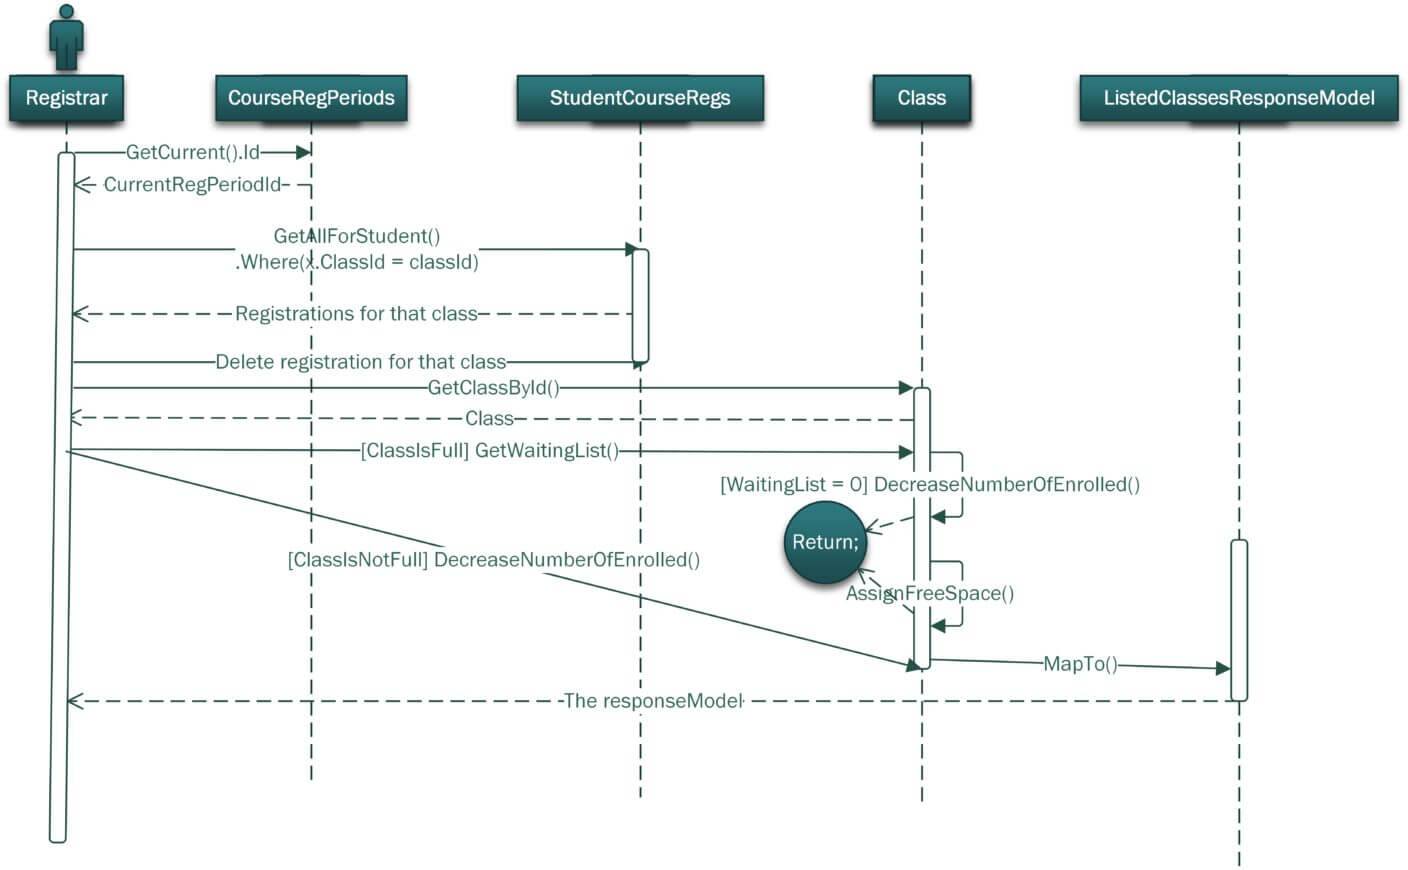
Each actor gets a lifeline. Messages flow top-to-bottom in chronological order. You can see exactly who talks to whom, when, and in what sequence.
State machine diagram
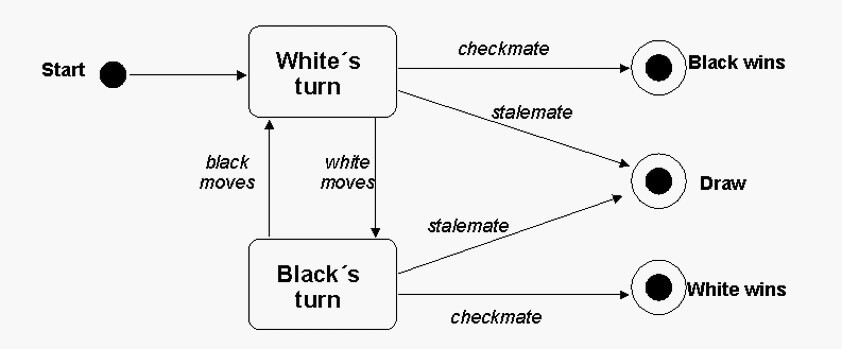
Also called statechart diagrams. These describe the different states something can be in and what triggers transitions between them.
A chess game is the classic example. White moves. Black moves. The game can end in checkmate, resignation, or a draw - different states of the same machine.
Communication diagram
Used to be called collaborative diagrams in UML 1.x. These show how objects exchange messages, using numbered sequences and arrows instead of the vertical timeline format of sequence diagrams.
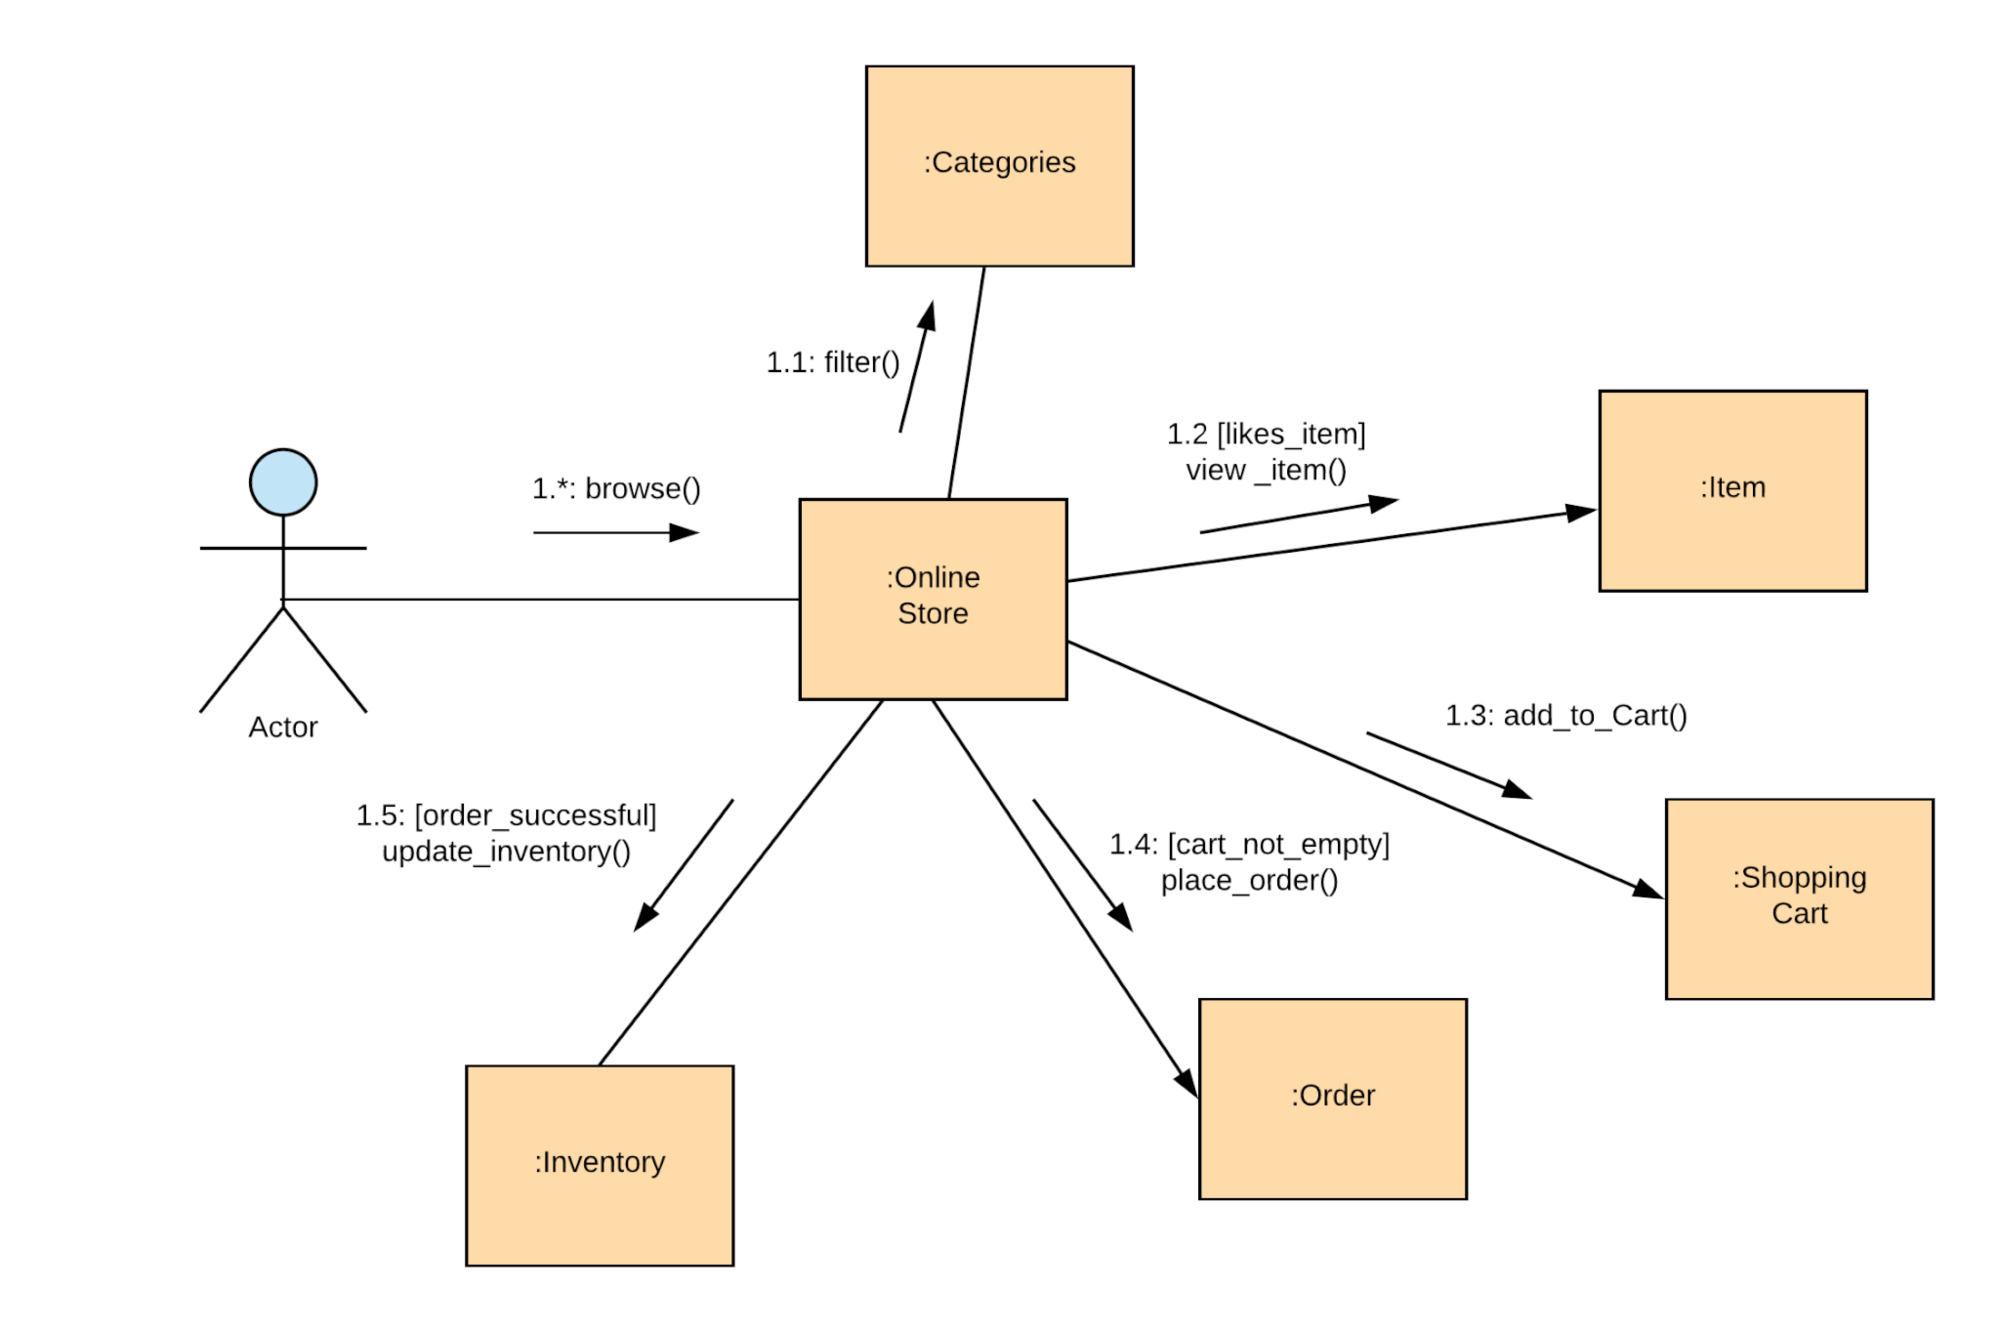
Honestly? If you’re choosing between a communication diagram and a sequence diagram, go with the sequence diagram. It’s better structured, better documented, and more widely understood. Communication diagrams are easier to draw - you can throw objects anywhere on the page - but that flexibility comes at the cost of clarity.
Interaction overview diagram
These are activity diagrams made of interaction diagrams. Sounds confusing because it kind of is. They combine the flow control of activity diagrams with the detail of sequence diagrams.
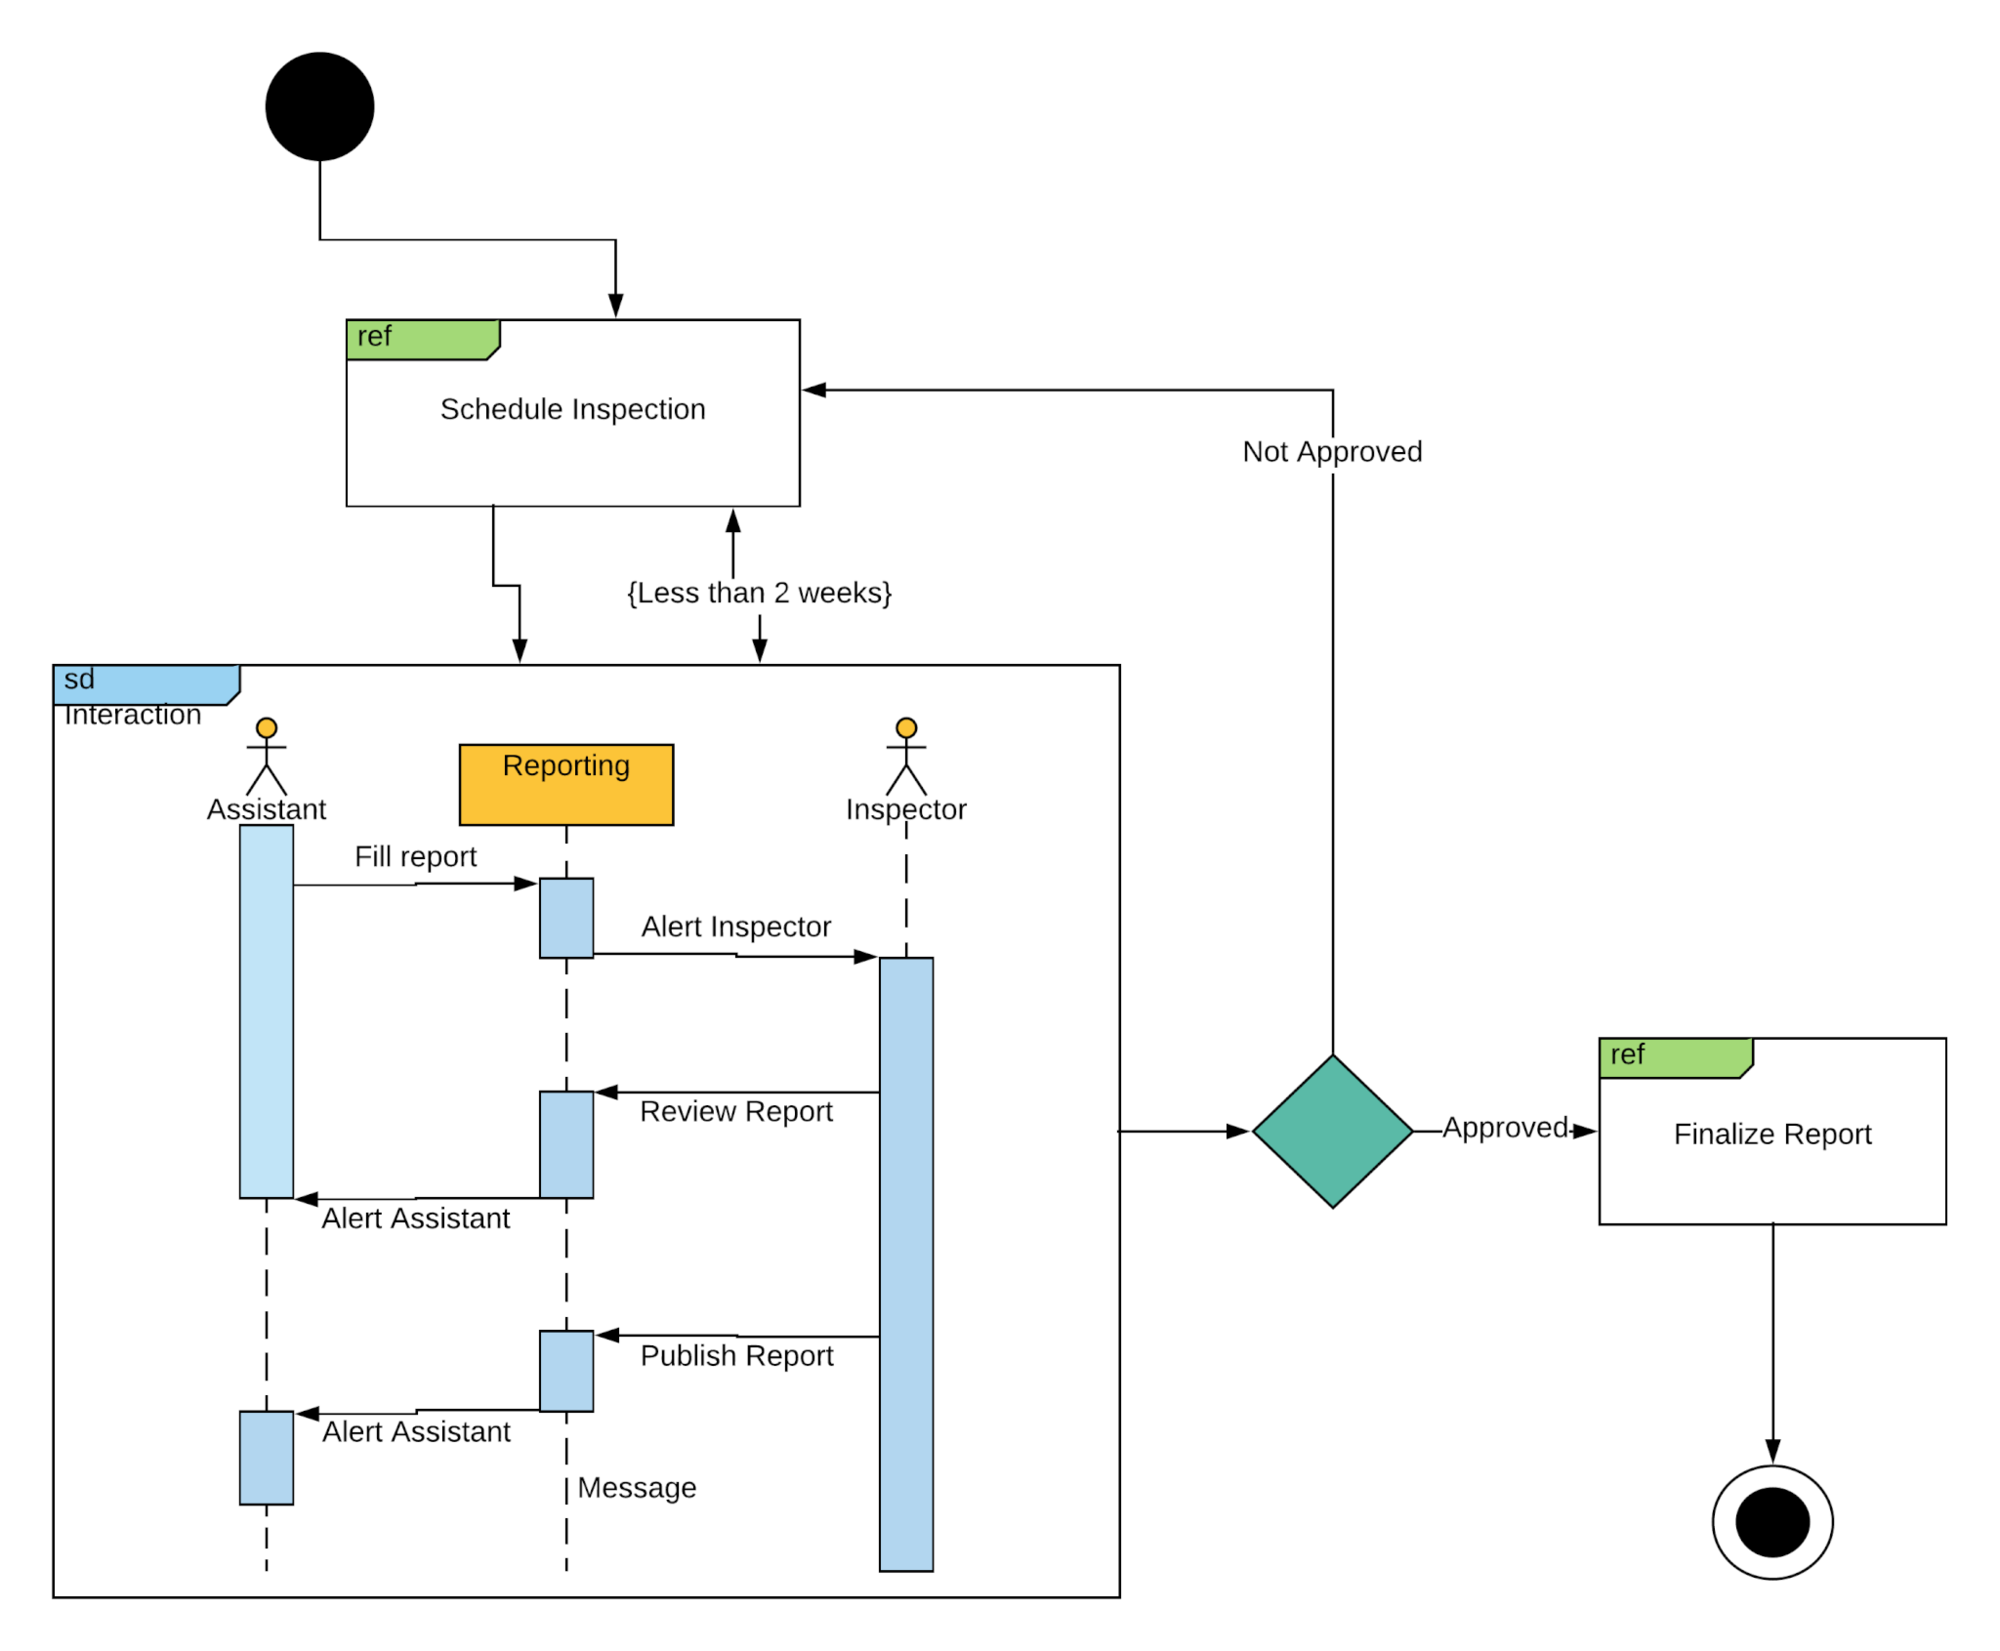
You get a starting point, ending point, and rectangular frames containing complete sequence diagrams. The flow branches and merges just like an activity diagram. Useful for complex systems where you need both the big picture and the details in one view.
Timing diagram
When you care about time constraints more than object interactions, timing diagrams are your tool. Each participant gets a lifeline that shows state changes along a linear time axis.
Key components:
- Lifeline - individual participant
- State timeline - stages within a pipeline
- Duration constraint - how long something takes
- Time constraint - windows within which things must happen
- Destruction occurrence - when a participant’s lifeline ends
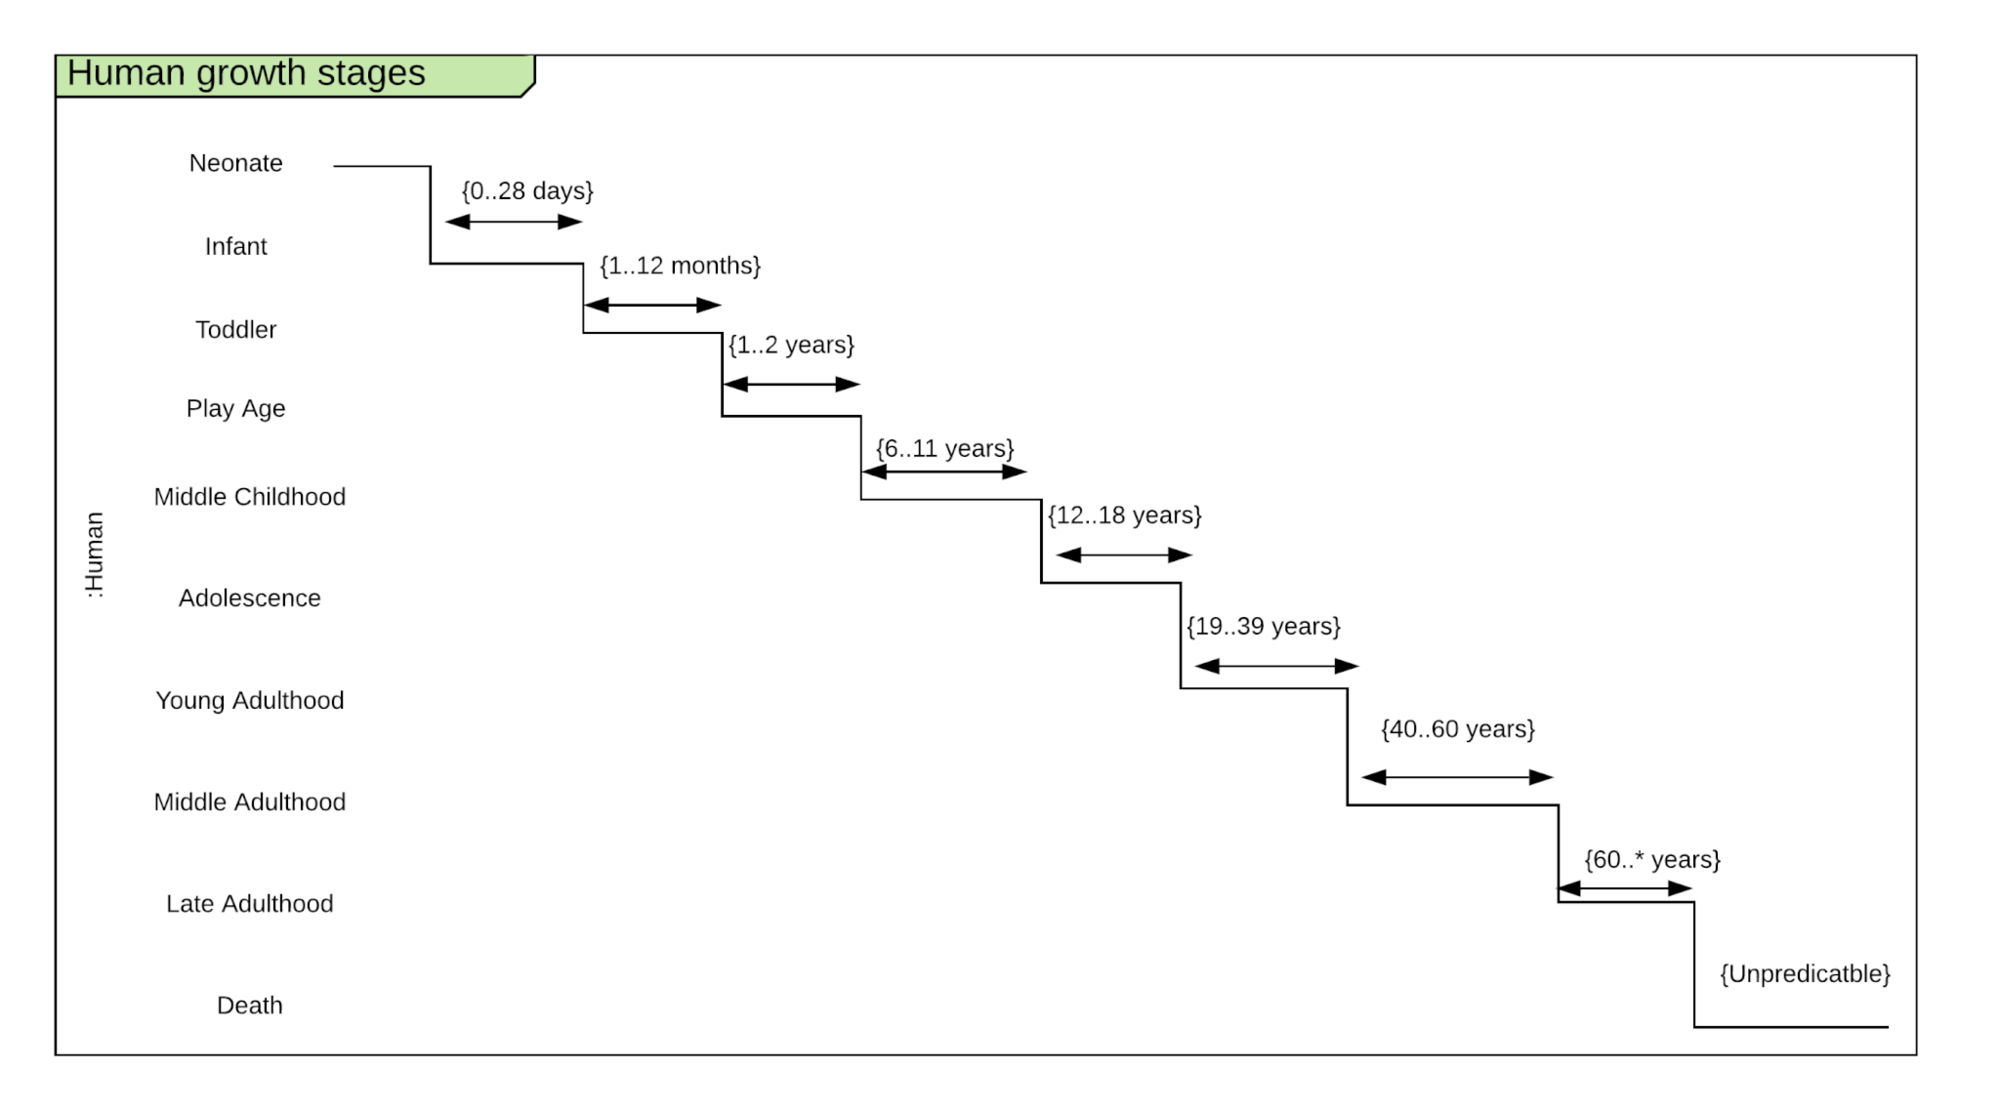
This simplified example shows human growth stages. One lifeline, multiple states. In practice, you’d use these for real-time systems, network protocols, or anything where timing is the thing that matters.
Structural UML diagrams
These show what exists - the architecture, components, and relationships in a system.
Class diagram
The most common UML diagram type. Period. Since most software uses object-oriented programming, class diagrams are the natural way to document it.
Each class has three sections: name on top, attributes in the middle, behaviors at the bottom. Lines between classes show relationships - inheritance, composition, association.
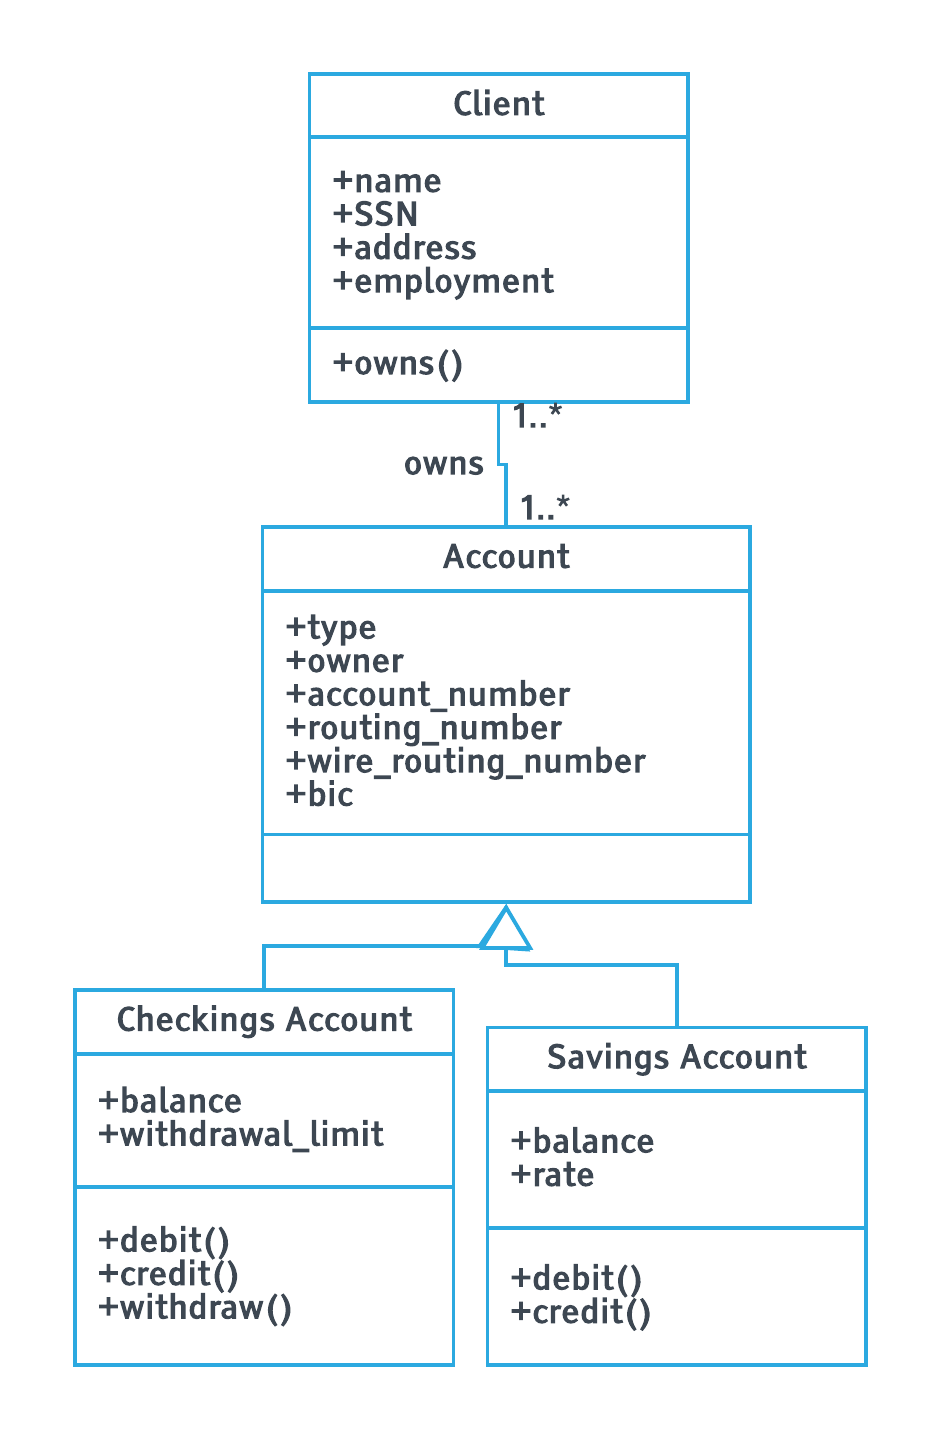
This ATM example shows “Checkings Account” and “Savings Account” inheriting from “Account” (blank-headed arrows indicate inheritance). The “Client” class connects to them. Self-explanatory.
Object diagram
If class diagrams are the blueprint, object diagrams are the house. They show specific instances of classes with actual values filled in.
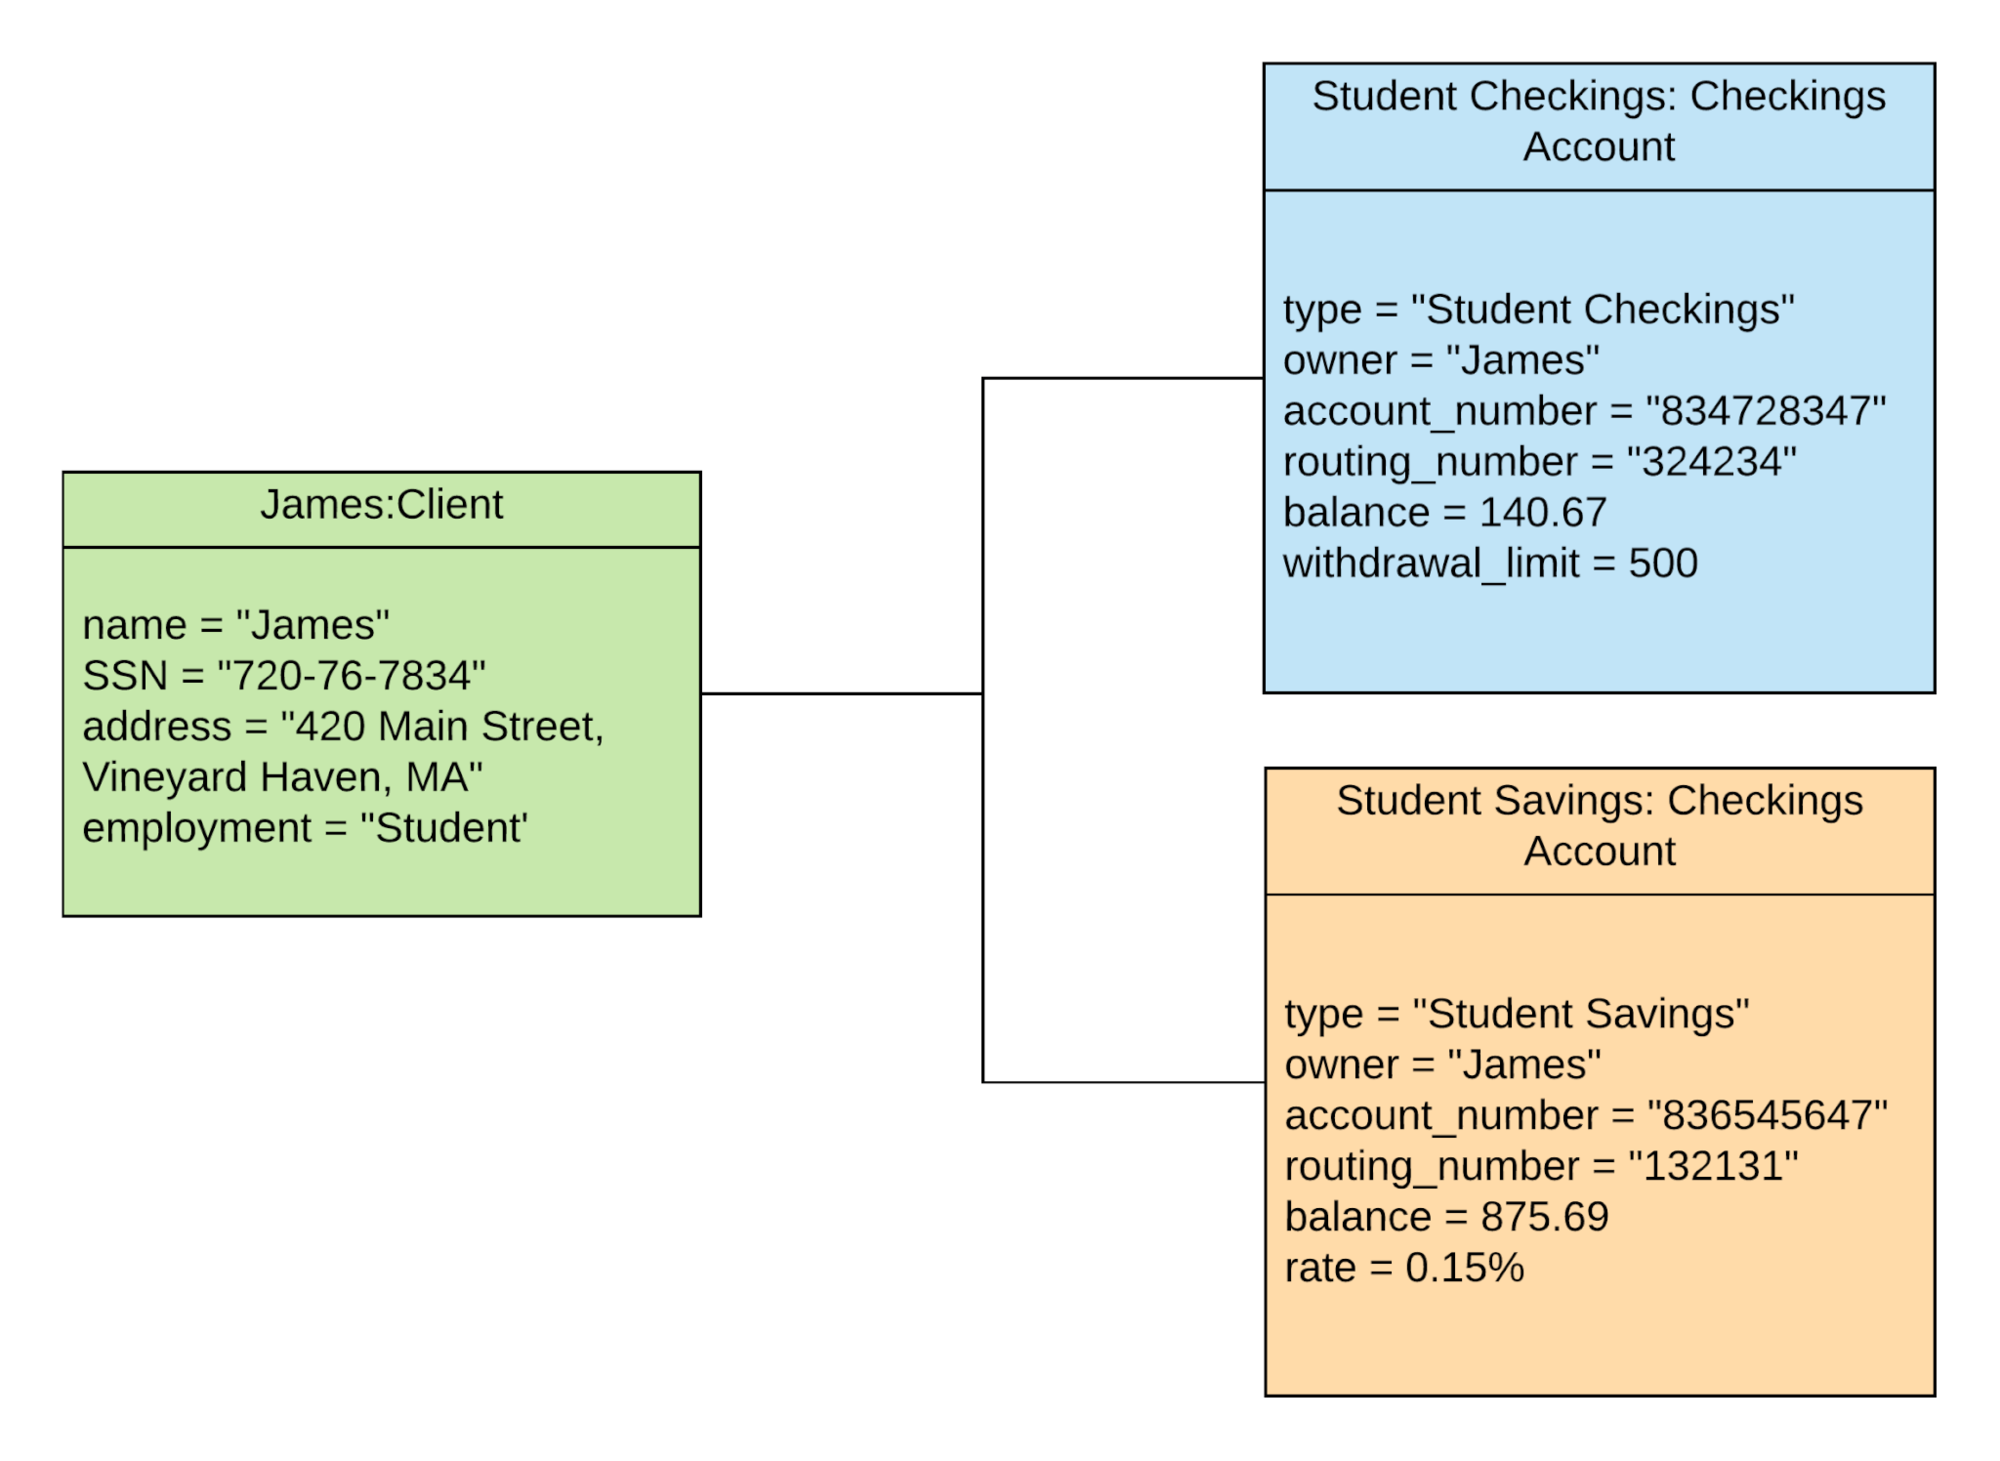
This takes our earlier class diagram and creates real instances - James as a client, with a checking balance of $140.67 and savings of $875.69. And here’s where it gets interesting: notice anything wrong?
The “account_number” and “routing_number” attributes are different between Checkings and Savings. That means they probably belong in the subclasses, not the generic “Account” class.
We also don’t use “wire_routing_number” and “bic” in this example. Design flaw? Maybe. That’s exactly the point - object diagrams catch problems that class diagrams hide.
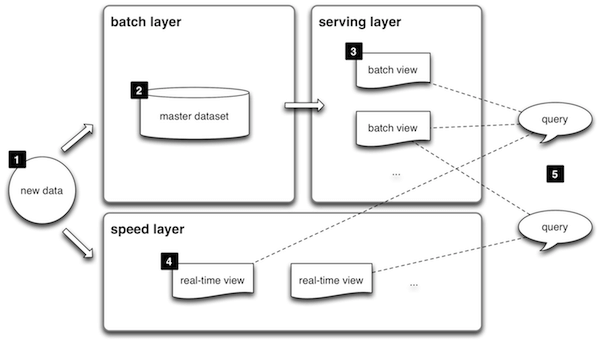
Component diagram
Complex systems need to be broken into smaller chunks. Component diagrams handle that. Think of lambda architecture - batch layer, serving layer, speed layer - represented as distinct components with clear interfaces.
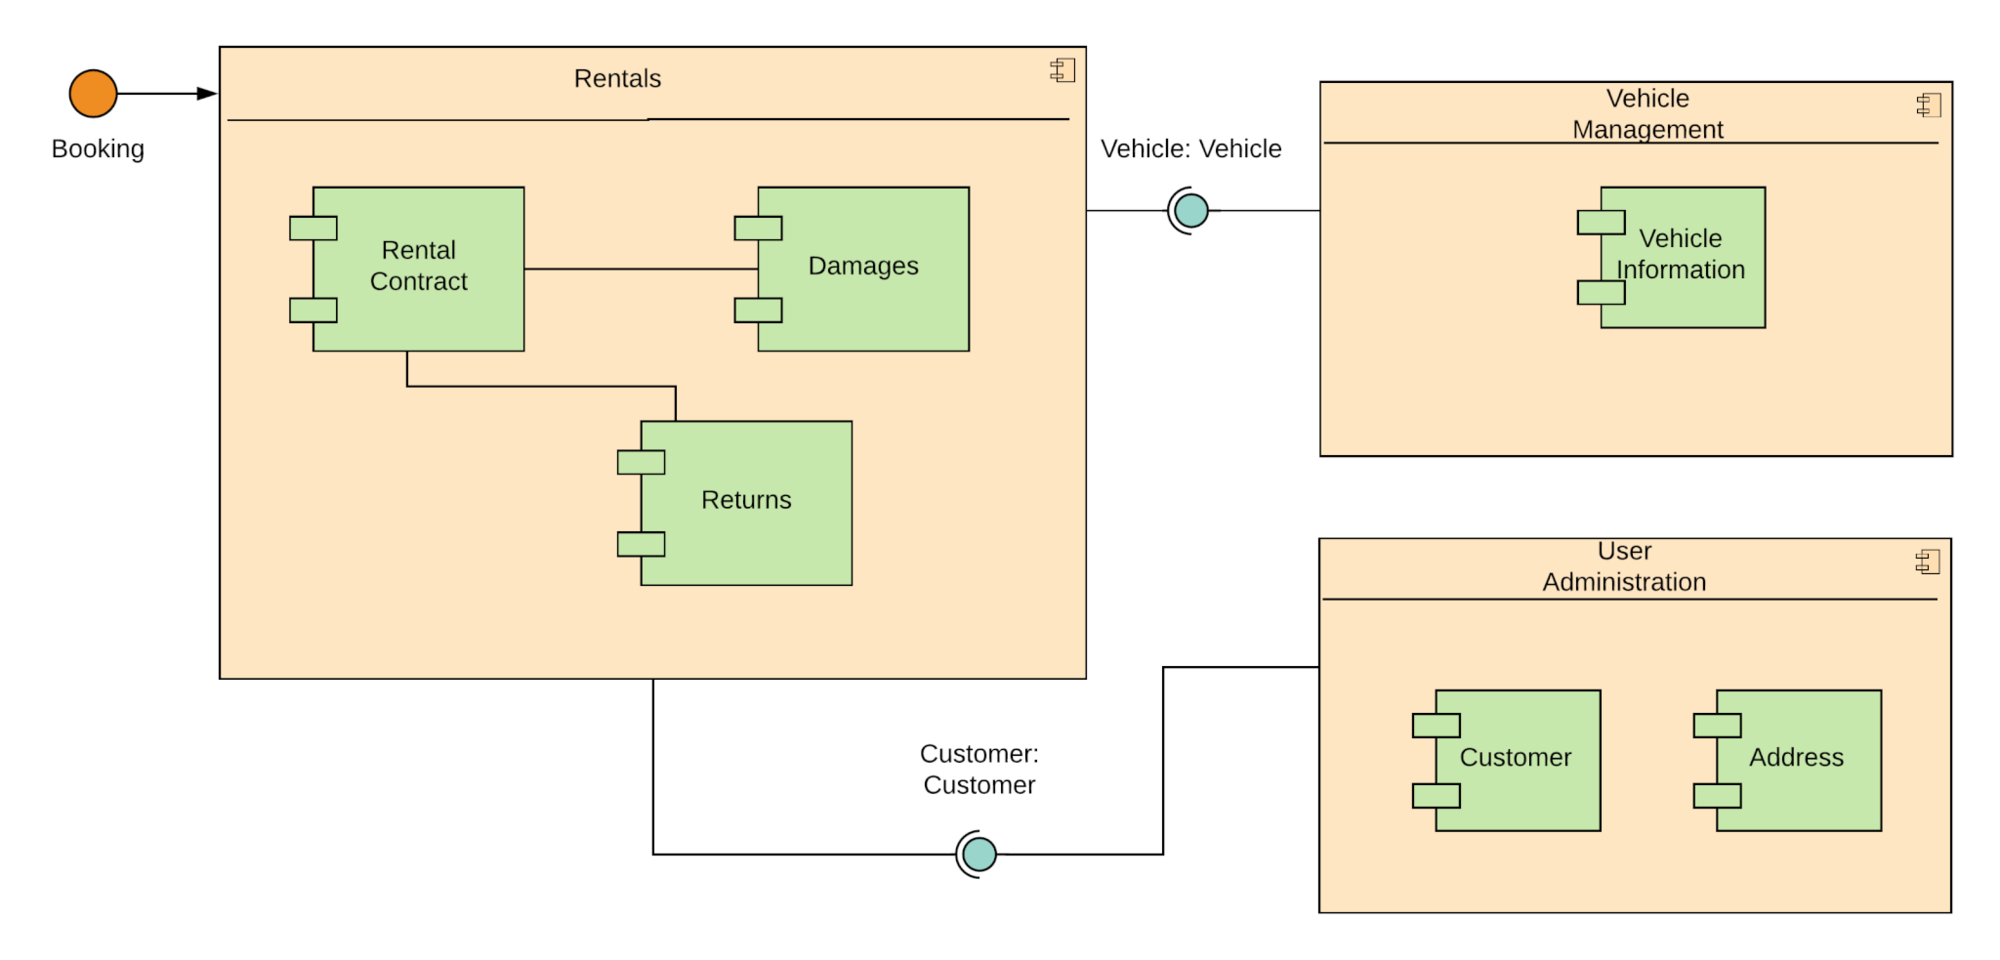
Composite structure diagram
Pretty niche. Shows the internal structure of a class and how its parts relate to each other. Business professionals almost never need these - they’re focused on top-level component communication, not the internals of individual classes.
Deployment diagram
Maps software to hardware. Shows which artifacts (software components) run on which nodes (servers, devices). A basic web app deployment diagram would show an application server node hosting the app client, connected to a database server node hosting the schema.
Package diagram
Think of these as containers for deployment diagrams. They group related components into packages - like namespaces in code. Useful for very large systems where you need to zoom out.
Profile diagram
Not really a diagram type - more of an extensibility mechanism. It lets you extend UML notation using:
- Stereotypes - create new UML elements
- Tagged values - add new attributes to existing models
- Constraints - add conditions like “outstanding balance must be greater than $3”
You probably won’t need this unless you’re creating custom UML profiles for specialized domains.
Which diagram should you use
This drives me crazy - people spend weeks learning all 14 types when they only need a handful. Here’s the honest truth:
| Your goal | Use this diagram | Why |
|---|---|---|
| Map a business process or workflow | Activity diagram | Shows flow, branching, parallel paths, swimlanes |
| Define what users need to do | Use case diagram | Clarifies requirements before anyone builds anything |
| Show how things interact over time | Sequence diagram | Chronological message flow between actors |
| Document code architecture | Class diagram | Standard for OOP documentation |
| Verify your design works | Object diagram | Catches flaws hidden in abstractions |
| Show system deployment | Deployment diagram | Maps software to hardware |
Everything else? You’ll use it when you need it. Don’t learn it in advance.
AI tools changed UML diagramming
Smarter agents without better workflows just means faster confusion. Right now, nobody’s building the workflows those agents need to follow. But the tools for creating diagrams? Those got dramatically better.
You don’t need to drag and drop shapes anymore. Here’s what the workflow looks like in 2026:
- Describe what you want in plain English -“Create a sequence diagram showing a user login flow with OAuth”
- AI generates Mermaid or PlantUML code - Claude, ChatGPT, or GitHub Copilot all do this well
- Code renders into a visual diagram - instantly, version-controlled, embedded in your docs
GitHub Copilot now has a Mermaid Chart extension. You can generate UML diagrams directly in VS Code. Microsoft released vscode-mermAId for AI-powered diagram generation.
There’s also a UML MCP server that lets AI agents generate UML diagrams through Model Context Protocol. This isn’t just drawing pretty pictures. It’s AI agents that can document, analyze, and improve your business processes autonomously.
Tallyfy was built around this exact insight. Process definition - the structured workflows that AI agents actually need to follow - matters more than ever. A UML activity diagram isn’t just documentation anymore. It’s the specification that an AI agent executes. AI doesn’t fix broken processes. It scales them. So getting the diagram right is the prerequisite, not the afterthought.
Diagrams-as-code is also hitting CI/CD pipelines. Teams version-control their Mermaid diagrams alongside source code, and diagrams auto-regenerate during builds. No more outdated Visio files sitting on someone’s desktop from 2019.
Tools for drawing UML diagrams
Things have shifted dramatically. Here’s what works in 2026:
AI-first tools:
- Mermaid - text-to-diagram, free, integrates everywhere. This is the default choice now
- PlantUML - more syntax options than Mermaid, great for complex diagrams
- Eraser.io - AI diagram generator built specifically for UML
- Claude, ChatGPT, or Copilot - describe what you want, get diagram code
Visual editors:
- draw.io - free, excellent, works in browser
- Microsoft Visio - powerful but expensive
- Lucidchart - good for collaboration, paid
Old school:
- Paper and a pen. Open a UML cheat sheet. Start drawing. Sometimes the simplest approach wins.
The honest recommendation? Start with Mermaid. It’s text-based, so it’s version-controllable, AI-generated, and renders beautifully. If you need more visual control, use draw.io. For a deeper dive into available options, we’ve covered software documentation tools separately.
About the Author
Amit is the CEO of Tallyfy. He is a workflow expert and specializes in process automation and the next generation of business process management in the post-flowchart age. He has decades of consulting experience in task and workflow automation, continuous improvement (all the flavors) and AI-driven workflows for small and large companies. Amit did a Computer Science degree at the University of Bath and moved from the UK to St. Louis, MO in 2014. He loves watching American robins and their nesting behaviors!
Follow Amit on his website, LinkedIn, Facebook, Reddit, X (Twitter) or YouTube.

Automate your workflows with Tallyfy
Stop chasing status updates. Track and automate your processes in one place.